Blind sample table description#
| Column | Description |
|---|---|
| ra | right ascension in decimal degrees (J2000) |
| dec | declination in decimal degrees (J2000) |
| r_auto | S-PLUS DR1 r-band magnitude (SDSS-like r) |
| mn170_pE | probability of the object being elliptical given by the classification of the trained model with objects with magnitude \(r_{auto} < 17\) (mn stands for "MorphoNet") |
| mn170_pS | probability of the object being spiral given by the classification of the trained model with objects with magnitude \(r_{auto} < 17\) |
| mn175_pE | probability of the object being elliptical given by the classification of the trained model with objects with magnitude \(r_{auto} < 17.5\) |
| mn175_pS | probability of the object being spiral given by the classification of the trained model with objects with magnitude \(r_{auto} < 17.5\) |
Trained network weights#
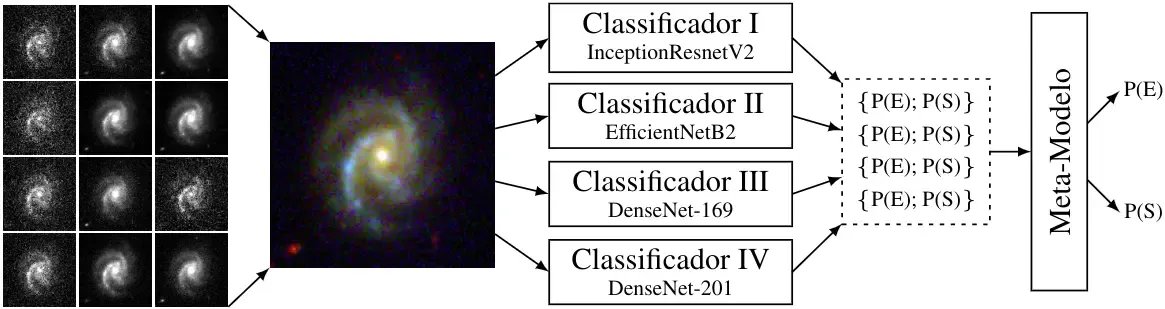
Weights of trained models as described in the paper. The network was trained with TensorFlow v2 and saved in SavedModel format. Each folder contains the model of a member of the Ensemble. A file in Python3 called MorphoNet Class is available that automates the loading of the weights of each member. It is recommended to use this class instead of making direct predictions as it standardizes member predictions with respect to training data as described in the paper.
Code Samples#
python
import os
import random
import numpy as np
import matplotlib.pyplot as plt
from mpl_toolkits.axes_grid1 import ImageGrid
import morphonet

# kind can be 'mn170' or 'mn175'
mn = morphonet.MorphoNet(kind="mn170", weights_folder="morphonet170")

# this method load the members and meta-model in memory
mn.load()

# load images to memory, using np.load in this case of .npy images
imgs = [
    np.load(f"colored_splus_stamps_npy/{f}")
    for f in os.listdir("colored_splus_stamps_npy")
]

# call predict method with a list of numpy arrays of shape (128, 128, 3)
preds = mn.predict(imgs)

# select a random sample to plot
ids = random.sample(range(0, len(imgs)), 100)

# plot the reults in a grid
fig = plt.figure(figsize=(14, 16))
grid = ImageGrid(fig, 111, nrows_ncols=(7, 7), axes_pad=0.3)
for ax, _id in zip(grid, ids):
    im = imgs[_id]
    ax.set_title(f"S={preds[_id][0]:.2f} E={preds[_id][1]:.2f}")
    ax.imshow(im)
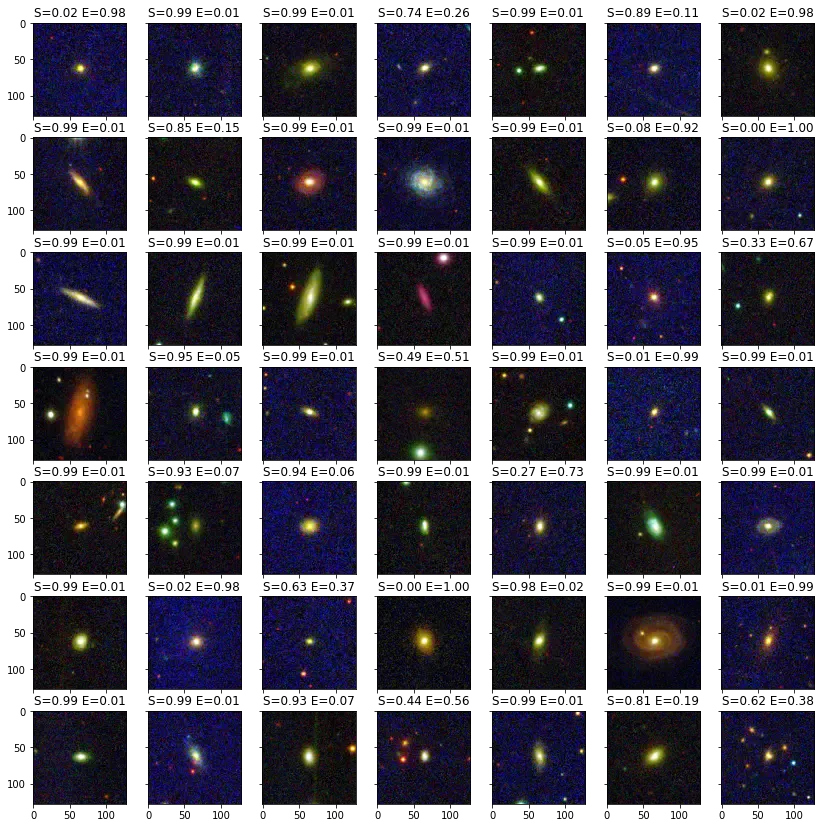
plt.show()